KPI Widgets Leads
There are 2 widgets available in the Leads area.
You can find KPI widgets in the "2 x 1 Widgets" type on the dashboard; further information on displaying them can be found here.
Leads processed today
The basis are the Activities and SalesLead that were Created today; all other Activities that do not generate an Activity are not counted. If more than one Activity is created for a Lead, only one is added to the widget.

- The number shows the Quantity for the current Day
- Black, if the Value is greater than 0
- Red, if the Value is equal to 0.
- The Blue chart shows the Values of the last 30 Days
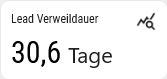
Lead dwell time
Shows the Average Duration in Days for all existing Leads on the Client from the last 12 Months.
Calculated from the first Day of processing a Lead until the Day of creation of a related Opportunity.